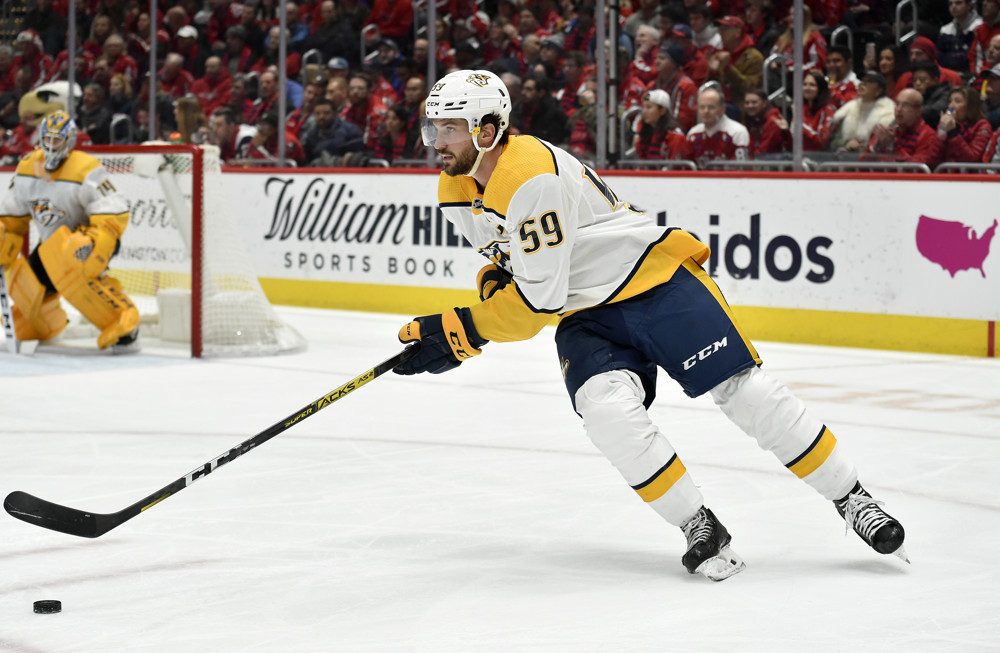
 I’ll admit, I can be kind of hard on Craig Smith. He’s inconsistent and rarely drives scoring, instead being a passenger. He also makes 4.25 million dollars per year for another two seasons and left many fans worried after a rough 2016-17 season. While the Nashville Predators were on the rise, he was seemingly dropping off. I’ve seen it happen to countless contenders and I wondered if getting rid of his contract meant sacrificing a prospect or pick.
Then the expansion draft came along and 5 million dollars mysteriously disappeared off the books. Suddenly the Predators had breathing room and they signed players like Scott Hartnell and Mike Fisher, but that wasn’t the only way this relief helped. The right wing spot was suddenly vacant on the second line and Craig Smith stepped up to the plate. The now 28-year-old showed that he still had what it took to play at a high level and produced great numbers.
Scorers Score
Before we get started, I should let you know that all stats you see below are at five on five unless stated otherwise.
The entire second line had a great season, Smith and Turris tied for most points on the line with 51. Smith led in terms of goals with 25, the most of his NHL, AHL, or NCAA career. On top of that, Smith produced the majority of his points at five on five, as he was third on the entire Predators club with 35.
Smith excelled at putting points on the board and owes a lot of that success to his willingness to shoot the puck. He was second on the Predators with 180 shots and fourth in terms of shot attempts with 292. Accuracy was a bit of an issue for Smith, but he was actually good at getting shots past would-be shot blockers. 246 of the 292 shot attempts were unblocked, good enough for second on the squad.
Scoring chances are where things get interesting. Smith was on the ice for 510 scoring chances for and produced a team-leading 172 of those. This isn’t a new development either, as Smith has always made the most of his time on the ice. He’s produced over 143 scoring chances in all but one of his seven seasons, but that came in a season where he only played 44 games.
Opposing defenses had few answers for Smith. He was actually the best Predator in terms of high danger chances created, a stat where Nashville was downright awful (21st overall). Fiala and Smith tied for first with 83 while Viktor Arvidsson came in third with 69, a number that is somehow nice, yet disappointing.
Making The Most Of His Time
Peter Laviolette trusted his second line with just over 12 minutes a night at five on five, of which Smith made the most of. Per 60 stats are where Smith shines, and where I first came around on just how incredible his season was. Smith was top five in all major categories except secondary assists, where he placed eighth. That low ranking isn’t without some shenanigans though, as Frederick Gaudreau and Samuel Girard are ranked first and second because of their tiny sample size in terms of ice time and games played.
Smith was a scoring machine as he potted .92 goals per 60, but that can be attributed to how much he shot. Seriously, he was second on the Predators and eighth in the entire NHL with 11.05 shots per 60. I, like many, wanted to know what changed with Smith. What happened to the third line player who looked like he couldn’t hit the backside of a barn? Well, it’s simple. His shots per 60 jumped three whole shots! That’s an astounding jump for a player, and oddly enough nothing really changed in the process. His linemates are definitely more skilled than they were a year ago but Fiala is usually a triggerman. It’s almost like Smith made a conscious decision to shoot more and it paid off in spades.
Other than that, Smith was one of the best players on the Predators in overall points per 60 while also dominating primary points per 60. In my opinion, this is good enough to keep him as the right wing on the second line.
Contributions
 I’m about to show you a chart and before anyone gets mad at me, I just chose Arvidsson as a comparable player because he’s a rightwinger and a shooter. I’m not saying they’re similarly talented or that one is better or worse than the other, but I just wanted to fill the second box with someone a little like Smith. This chart is obviously not displaying all pieces of the puzzle but is only there to provide a little context, Arvidsson faces much tougher competition than Smith does. So there’s the disclaimer for the Arvy stans out there. Without further ado, let’s take a look at the chart.

 We’ve spent the last 800 words or so talking about Smith’s offensive contributions, so we’ll just gloss over it. It’s cool that he’s ranked in the 99th percentile in the NHL for shots per 60, but we’re beyond that now. Let’s talk about zone entry. Smith is one of the better Predators at possession entries per 60, and is in the 70th percentile in the NHL. He uses his speed as a weapon and does not shy away from attacking the middle. His ability to break away and attack from any part of the ice creates some doubt in defensemen on which way he’ll go. Often, you’ll see him attack the center of the ice only for him to cut to the outside at the last moment.
One of the things I enjoy most about the Predators’ top six is their unwillingness to relinquish possession. I’m pretty sure they’d rather turn back and regroup rather than dump and chase, which is a good thing in my opinion. Smith is actually the “worst” player on his line in terms of controlled possession entry percentage. He’s in the 60th percentile, an objectively good number but that pales in comparison to Fiala (94th percentile) and Turris (85th) percentile.
Smith was carried in terms of zone entries and exits despite posting somewhat respectable numbers. Turris requires Smith to produce any offense but Smith requires Turris to actually exit his own zone. Fiala can do everything on his own and believe me, I’ll write an article detailing how good he was this year, but now is Smith’s time.
Zone exits are really the only advanced analytic that doesn’t paint Smith in a positive light. He was in the 51st percentile for controlled possession exits per 60, but the majority of his zone exits came from dumping the puck or passing it out. It’s not necessarily a bad thing, but it does often lose possession and is more dangerous than just skating the puck out.
All In All
 All in all, Smith surpassed every expectation I had of him this season. Dare I say it, but I’m not sure how much better James Neal would’ve been. In fact, I’ll post the same comparison tool I posted above to compare the two at the bottom of the article.
Smith will start next season as a 29-year-old and will have two more years left on his deal. I don’t see any major regression in his immediate future and his place on the second line should be assured. He only shot at 8.33% and had a PDO of 102.5, but that was mostly because Nashville goaltending stopped the puck at 94.08% with Smith on the ice.
With all the disappointment that the playoffs brought, it’s good to look back and congratulate a player who had an incredible season that went somewhat under the radar. Now, as promised, here’s the Neal and Smith comparable chart. The results are quite interesting.


