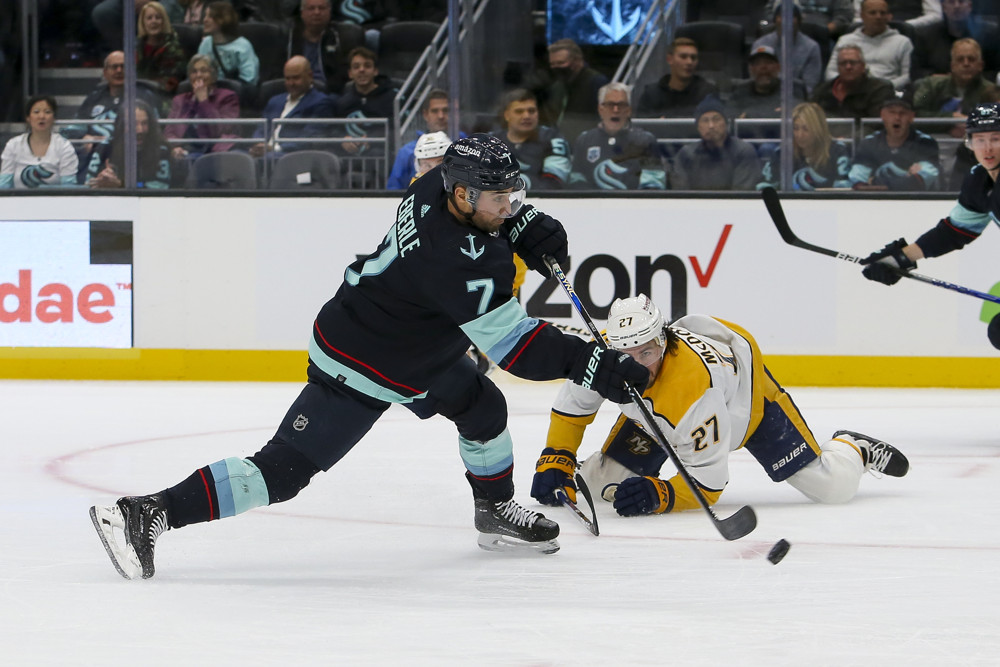
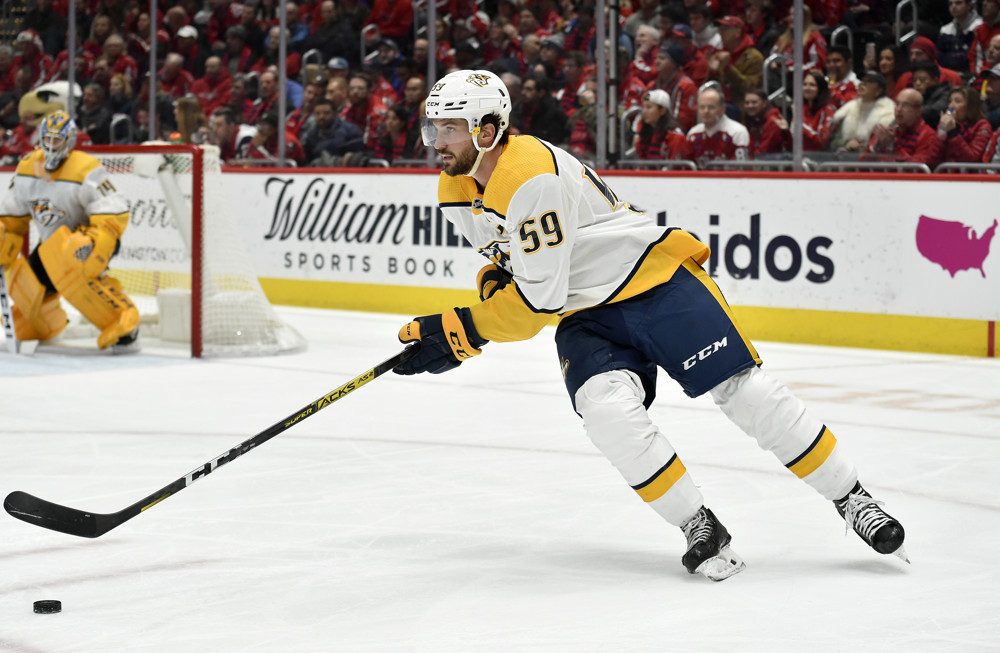
So far in Approachable Analytics, we’ve discussed shot attempts and zone starts. Shot attempt metrics are limited by their lack of context; while they provide a useful glance at puck possession, they can gloss over a huge number of details. Zone start percentage provides a bit of context when handcuffed to another metric, but is also missing a big piece of the puzzle.
Now, we want to discuss how to break down the shot attempts themselves. Part of the problem with Corsi and Fenwick is that they treat almost all shot attempts, whether a miss, save, broken stick, etc., the same. For example, if Player A contributes to 20 missed shots and Player B to 20 saved shots, Corsi says they possessed the puck equally well.
Obviously, the quality of each “shot attempt” can vary significantly. Consider how many different possible outcomes there are for a shot attempt, as well as the fact that we have huge amounts of data over several seasons. After all this time, people have pretty well figured out what types of shot attempts produce the most goals.
Scoring Chances
The name of this particular metric does slightly give it away. To really determine the contribution of a player, it’s best to get detailed. As such, we’re moving away from simply tallying each time a shot is attempted, and towards what happens after. How many scoring chances does the player contribute to, at both ends of the ice?
Scoring chances are broken down into three categories: low-danger, mid-danger, and high-danger. Unfortunately, determining which category each chance falls under is slightly complicated. Generally, analysts use a points system, such as the following:
This illustration (based on average goals per scoring chance) below gives a rough idea for how location is typically scored:
A high-danger chance is typically a scoring chance that receives a score of at least three points, a mid-danger chance a score of two, and a low-danger chance a score of one or zero. From a points perspective, the location of the chance is essentially the most important factor.
Admittedly, the details of scoring chances can be tricky to understand. In principle, however, the goal of tracking them is pretty simple: to quantify and better understand what’s happening on the ice. Breaking down scoring chances into categories (based on how likely a goal is to result from each) allows teams to make more informed decisions, if applied correctly.
Test yourself
Because I’m feeling compelled to bring back painful memories of math class, it’s time for a pop quiz! Of the two scenarios below, one would be counted as a high-danger chance, and the other as a mid-danger chance.
The St. Louis Blues are carrying the puck through the neutral zone when, all of a sudden, Calle Jarnkrok heroically forces a turnover, enters the attacking zone, and fires quick shot from just below the blue line. Jake Allen makes a good save but kicks the puck out to a fresh Kevin Fiala who hits a one-timer from the low slot.
In the offensive zone, Ryan Johansen carries the puck around the net before making a quick pass to Filip Forsberg, who sees an opportunity and fires quickly from the low slot. The shot is blocked by Colton Parayako before Jake Allen covers the bouncing puck.
 Call Kenny Loggins
Creating scoring chances, while limiting those from opponents, is as fundamental as hockey gets. How does this dynamic contribute to real results, though? Last season, nine of the top fifteen teams in terms of scoring chance ratio made the playoffs, and ten of the top fifteen teams in terms of high-danger scoring chance ratio made the playoffs.
The Predators’ scoring chance numbers (on offense and defense) did not illustrate a sustainable level of success. They produced 1639 (24th in NHL) scoring chances for and 1649 (7th in NHL) scoring chances against. This ratio comes out to 49.85% scoring chances for, good for 17th overall in the NHL. Even when you focus on just high-danger scoring chances, Nashville was average at best.
It seems odd that a lackluster team, in this regard, would also win the President’s Trophy. What gives? Are hockey analytics a sham run by idiots? Maybe, but they’re our idiots, and we love them.
Michael and I had a long-running joke during the season that we’d both be at the Predators’ Cup parade with signs reading, “Rinne’s high danger save percentage was unsustainable” and, “The high danger numbers didn’t add up”. In truth, these were indeed our biggest concerns for the 2017-18 Nashville Predators.
Despite the jokes, I can tell you exactly why the Predators won the Presidents Trophy: Pekka Rinne stopped 401 of 446 high danger chances at five on five for a save percentage of .897.
If you’re accustomed to reading about overall save percentages, that doesn’t sound terribly impressive. However, in terms of high-danger scoring chances, that’s better than any starting goaltender last season, aside from Ben Bishop. On top of that, the Predators had the best high-danger shooting percentage in the league at 14.95%, almost 2% higher than the league average. Over a full season, that 2% is monumental.
In other words, the Predators won the President’s Trophy by having otherworldly goaltending, as well as being more effective with fewer of their own chances.
 We’ve all heard the old phrase, “hard work beats talent when talent doesn’t work hard”. Well you can throw it away. The Predators’ talent beat the hard work of the opposition’s defense. I’m not saying the Predators weren’t working hard, but their skill was carrying them past most teams.
On a related note, you can guess what happened when the luck ran out and the production by the JoFA line dried up. Actually, you don’t have to guess, you can go re-watch their playoff run to see regression in real time. Fascinating, really.
 Conclusion
SCs and HDCs can be confusing. We know they’re important, but just how much do they actually mean? Could one HDC be worth two or possibly more SCs? Maybe talent is the end all, be all of hockey and you’ll continue to win as long as you can out-skill the other team.
George believes that coaching and systems are a big reason for the Predators’ failures in the playoffs. A borderline divine Pekka Rinne and some nice puck luck kept the coaching staff from ever re-evaluating their systems because the Predators never really went through a cold streak. The playoffs proved that relying on a God-like goaltender and a high shooting percentage isn’t sustainable, let’s hope the coaching staff rectifies this through something new.
George and Michael are always open to questions, comments, and brief public humiliation. Feel free to reach out to them on Twitter (@GeorgeM1019 and @WadeM117), or to Penalty Box Radio on Twitter and Facebook.
Answer Key
High-danger chance: Jarnkrok gets two points for a low-danger shot (+1) off of a turnover (+1). Additionally, the puck gets kicked out for a rebound shot (+1). In total, it’s three points.
Mid-danger chance: The shot came from the low slot (+3), but the shot is blocked by a skater (-1). The total is two points.


