 Shot Attempts: the Bread and Butter of Hockey Analytics
Objectively speaking, there is nothing terribly controversial about “advanced analytics.” It seems ridiculous that something like complicated numbers could produce a conflict of considerable size within the sports community, but here we are.
In one corner, we have “Team Grit,” who uses words such as “heart” or “tough” a lot. These t-shirt clad warriors are heroes of the Hollywood style sports tale: willpower wins. “Team Spreadsheet” stands in the opposite corner, armed with laptops and wire-rimmed glasses. This team represents the more innovative culture within sports fandom, for better or worse.
In hockey, this cage match is waging now more than ever. However, I’d argue that it’s simply unnecessary. At the end of the day, each of us loves the sport above all.
Regardless of where you fall on the analytics spectrum, welcome to the first of many “Approachable Analytics” installments. In this series, we’ll break down all of the terms and phrases you might encounter in hockey analytics. If you’d like more context about how each metric is applied to games, teams, and players themselves, be sure to check out our own analytics-based Between the Fangs Podcast.
Without further ado, let’s talk shot attempts.
Corsi
I’d wager that you’ve heard the word “Corsi” before. Although it gets thrown around casually these days (and occasionally sarcastically), hockey analytics owes a lot to this simple metric. The NHL actually refers to Corsi as “shot attempts,” or “SAT” for short. To the league’s credit, their name makes a lot more sense, but I digress.
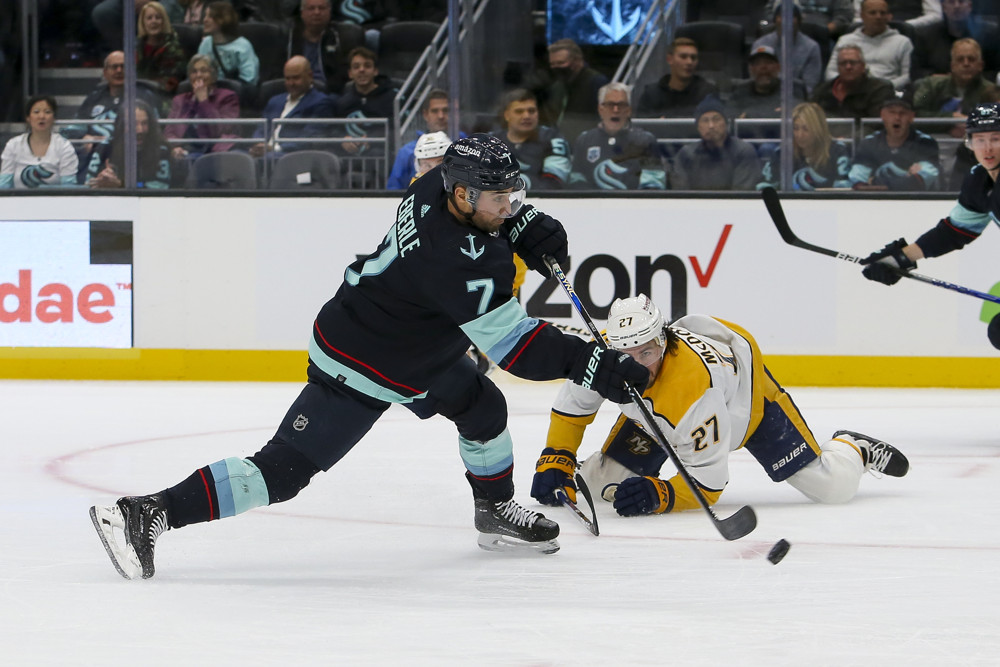
Corsi was created by a financial analyst named Tim Barnes. After hearing Darcy Regier (then-General Manager of the Buffalo Sabres) discuss shot differential, Barnes developed a formula that uses shot attempts to help determine possession. The rationale for this approach is simple: a team has to be in the offensive zone to create a shot attempt, or in the defensive zone to concede a shot attempt. Therefore, shot attempts can be used to measure overall possession.
When you’re looking at these statistics online, you’ll come across a few acronyms. A shot attempt for a team is referred to as CF, or “Corsi for.” Similarly, a shot attempt against a team is referred to as CA, or “Corsi against.” These are used to calculate the “Corsi for percentage,” or CF%.
Corsi for percentage is about as simple as it gets in mathematics:
At the end of the day, the goal for a team or player is to maximize this percentage. If your team produced 50 shot attempts and allowed 25, your CF% would be a very admirable 66.7%. More often than not, over the course of a game, both teams will hover around the 50% mark (something, something parity and all).
Corsi can be applied to players, teams, lines, defensive pairings, or really anything. There are countless websites and programs nowadays that will calculate the CF% for any combination your heart desires.
Unfortunately, what makes Corsi so elegant is also its primary limitation: its simplicity. If you’re looking for the most basic descriptor of a hockey performance, it’s a good starting place. However, it is relatively unhelpful without significant context. This brings us nicely to our next subject.
Fenwick
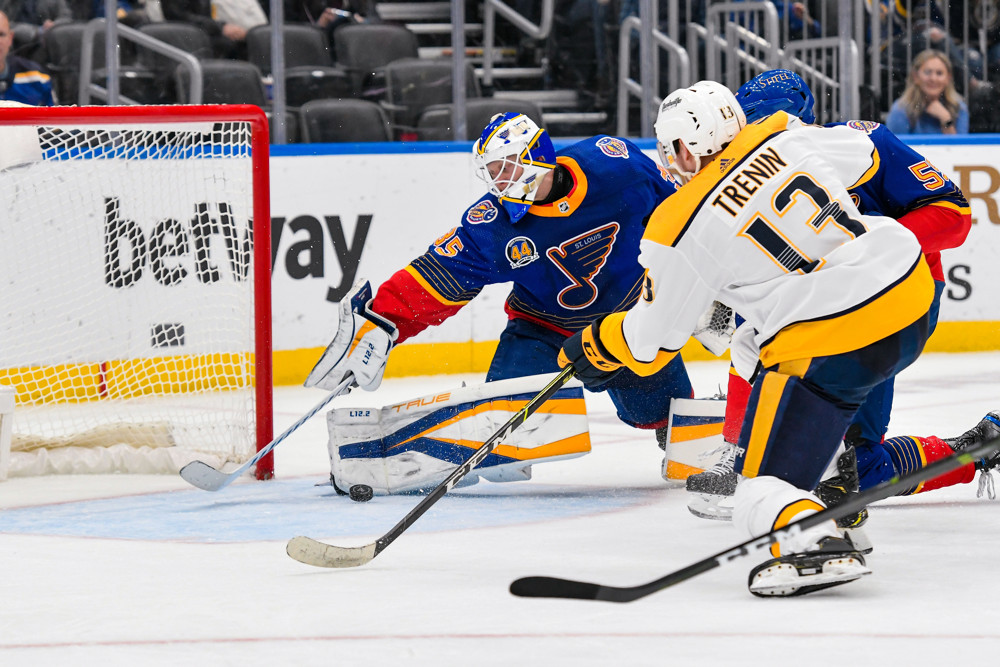
 Fenwick is a very basic extension of Corsi, and is calculated identically. The difference is in what we consider a shot attempt. In Corsi, a shot attempt really is exactly that: any attempt to put the puck on net. Obviously, there are numerous factors that determine what happens to a shot attempt. Does the goalie make a save? Does the shooter’s stick break? Does the shooter miss the target entirely? Corsi treats all of these situations the same.
Fenwick comes from the argument that a team shouldn’t get credit for a shot that gets blocked by a skater. Additionally, a team or player shouldn’t lose credit for blocking a shot attempt against them. It makes sense, then, that Fenwick is also referred to as “USAT,” or “Unblocked shot attempts.” Frequently, though, you’ll see FF, FA, and FF%, or “Fenwick for,” “Fenwick against,” and “Fenwick for percentage,” respectively.
Corsi and Fenwick use the same basic equation, but can produce different interpretations of the same situation. For example, the 2017-18 Los Angeles Kings had an above-50% Corsi, while having a below-50% Fenwick at five on five. The separation isn’t large, but it’s interesting to see how shot blocking played a part. Because of this small distinction, I personally prefer Fenwick over Corsi. It doesn’t change much, but the slight refinement makes it a stronger descriptor of a given on-ice situation.
That said, the issues that plague Corsi also plague Fenwick. Context is everything, and Fenwick still ignores it like a college senior ignores a professor in an elective course.
Let’s Talk Preds
 Last season, the Predators’ champion of shot attempts was Craig Smith, who dominated both Corsi (56.78 CF%) and Fenwick (56.88 FF%). In a future installment, we’ll get into the context of his usage, but these numbers don’t lie; Craig Smith excels in puck possession. In fact, Smith’s entire line was a possession giant that suffocated the opposition with quick passing and an unrivaled willingness to shoot the puck. Hopefully, in this coming season, those attempts will translate into more goals. After all, the final scoreboard is the ultimate spreadsheet.
George and Michael are always open to questions, comments, and mild threats. Feel free to reach out to them on Twitter (@GeorgeM1019 and @WadeM117), or to Penalty Box Radio on Twitter and Facebook.


